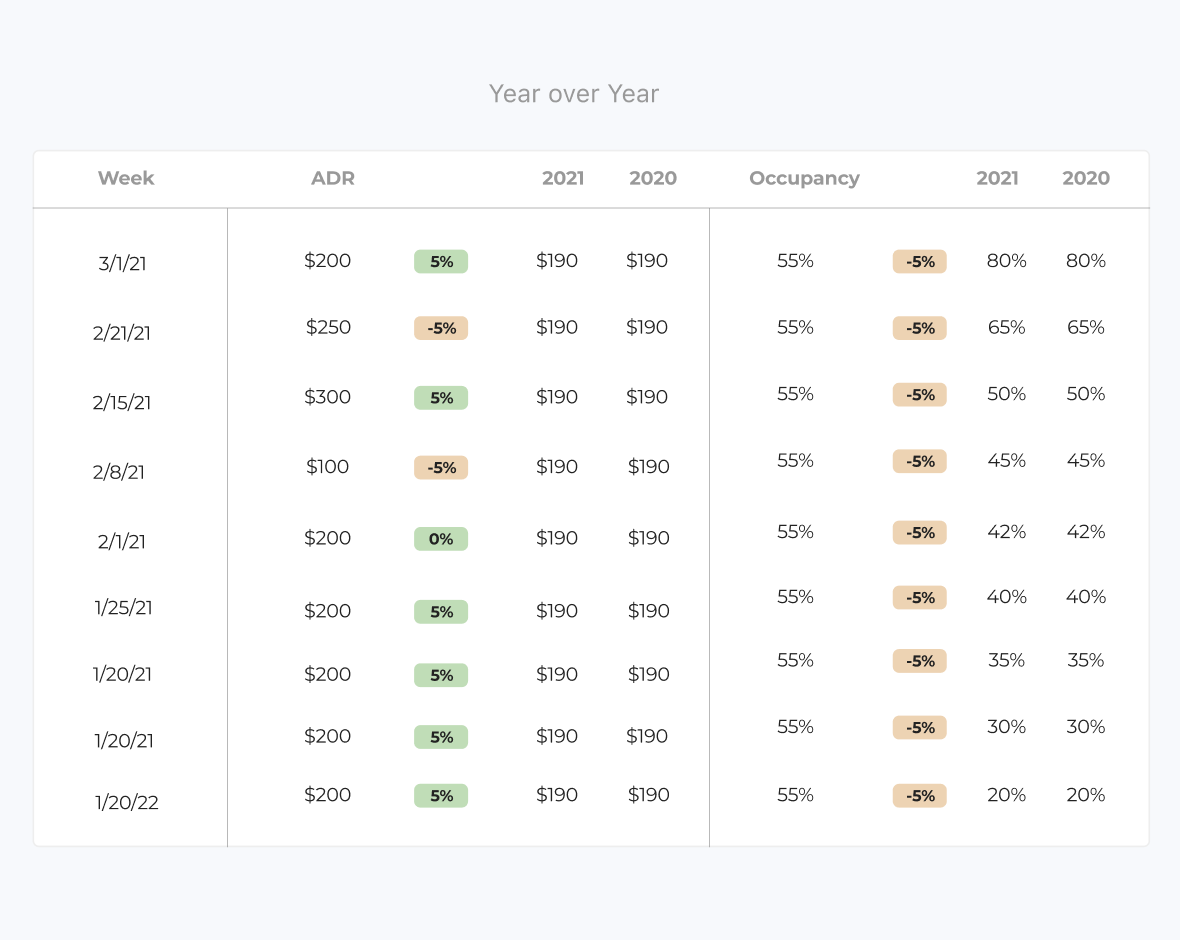
Year-over-Year Analysis
Comparison of 2 KPIs as-of specific dates, over historical years. Users can see how they stack up for the same as-of dates year over year.
This can inform several insights:
- Am I booking as fast as I did last year?
- Is my ADR better than it was for the same week of the previous year?
- How did my new pricing strategy affect my booking pace compared to last year?
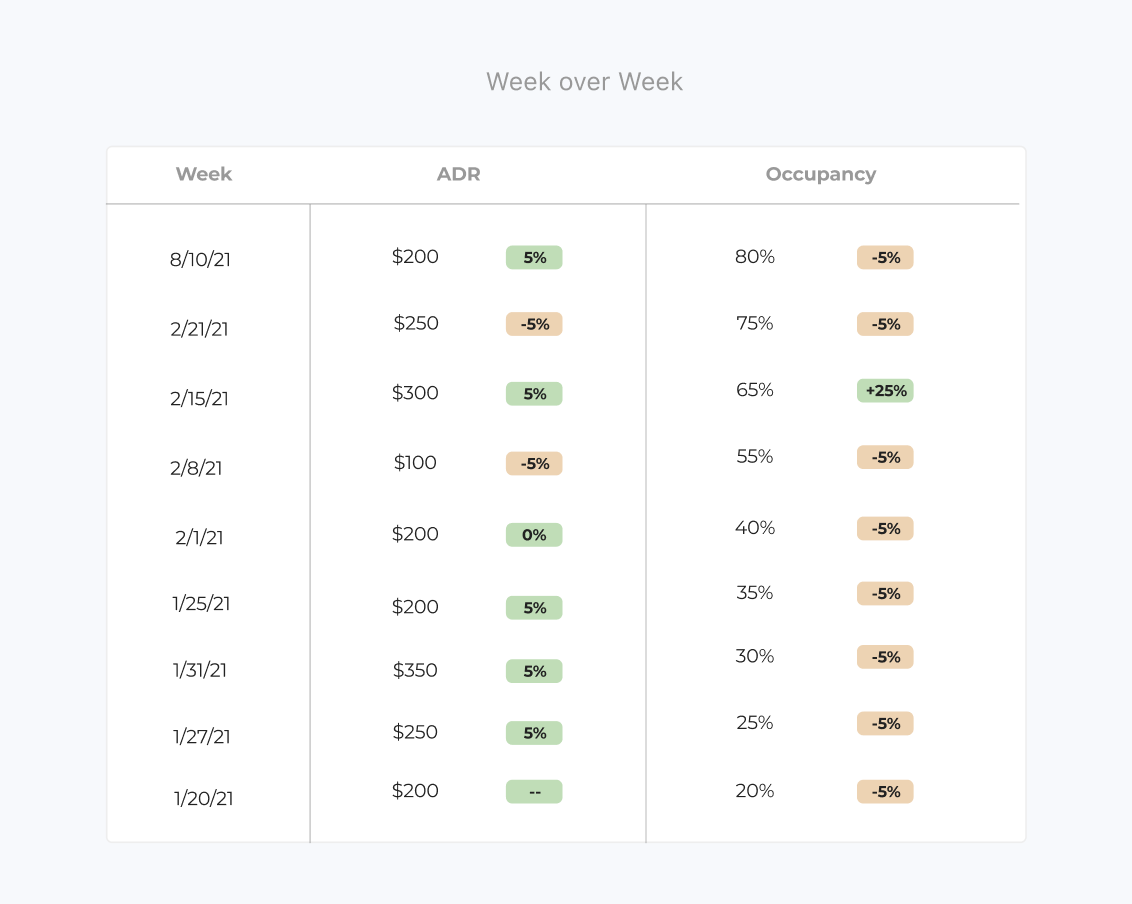
Week over Week Analysis
Analysis of ADR + Occupancy as the specified arrival date approaches. This table is a descending view of KPI changes up until the arrival date.
This can inform several insights:
- What week did my occupancy grow the most? What was the catalyst for that?
- My ADR is lower than I’d like it to be, what can I do about optimizing that?
- Did my marketing push help increase my Occupancy and Revenue?
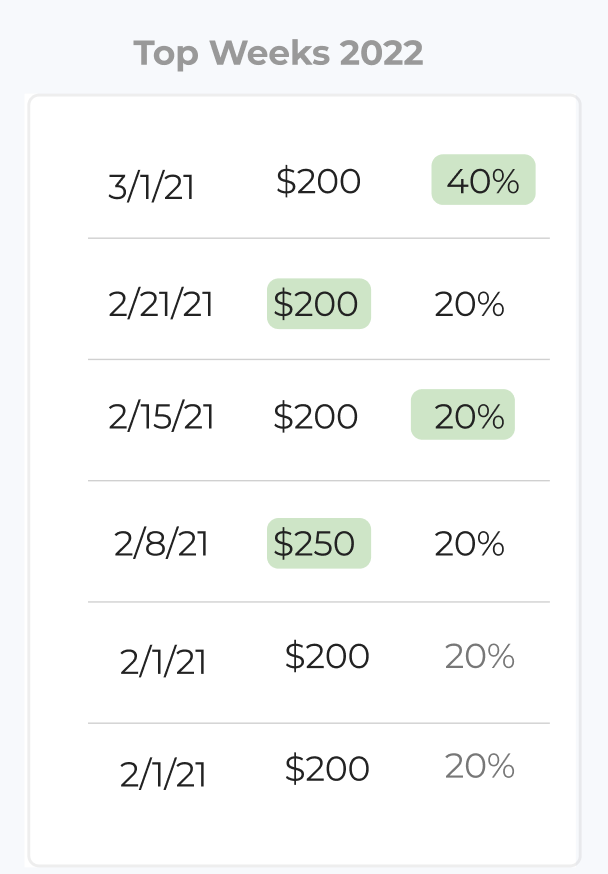
Top Performing Weeks
As a user, I can see which weeks were my top performers in terms of the highest gains based on the KPIs selected.
This tells me:
- What weeks have been the most impactful for my revenue strategy for this arrival date
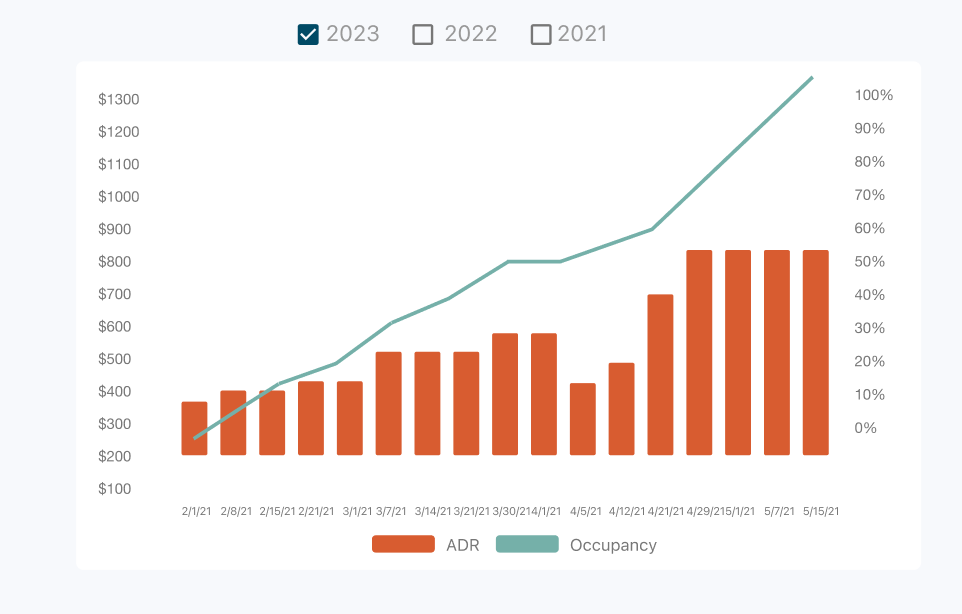
KPI Graph
Visual Representation of Week over Week data – view current or historical year
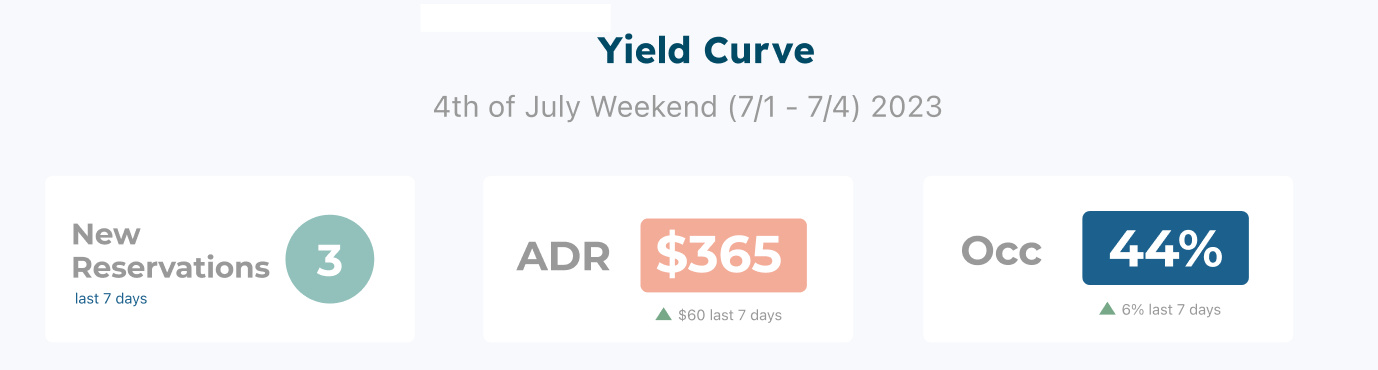
Informational Cards
High-level summary of last 7 days of activity for the arrival period selected…in this example I’ve gained 44% occupancy, my ADR was $365 for bookings in the last 7 days, and the green arrows show the variance as of 7 days ago.