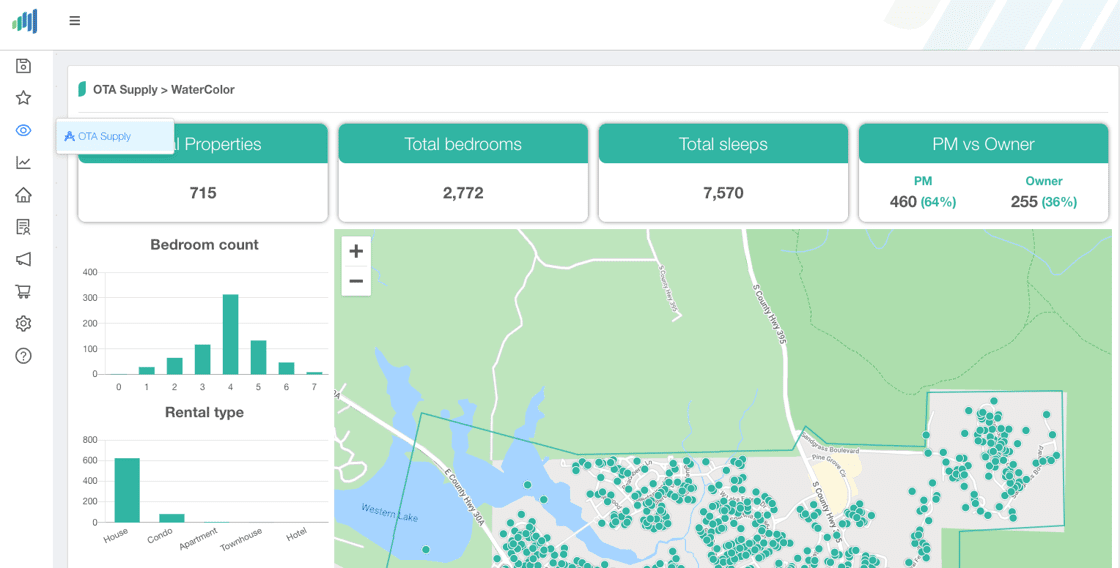
OTA Supply is now available to view in the Market Insights section! Now you can view the entire inventory selection within the markets that you participate in AND quickly find your advertised competitors, along with their marketed site, to gain insight about pricing, availability, and amenities.
Want access to OTA Supply for additional markets? Simply navigate to the marketplace icon in your dashboard to view additional markets available for purchase.

Enhancements |
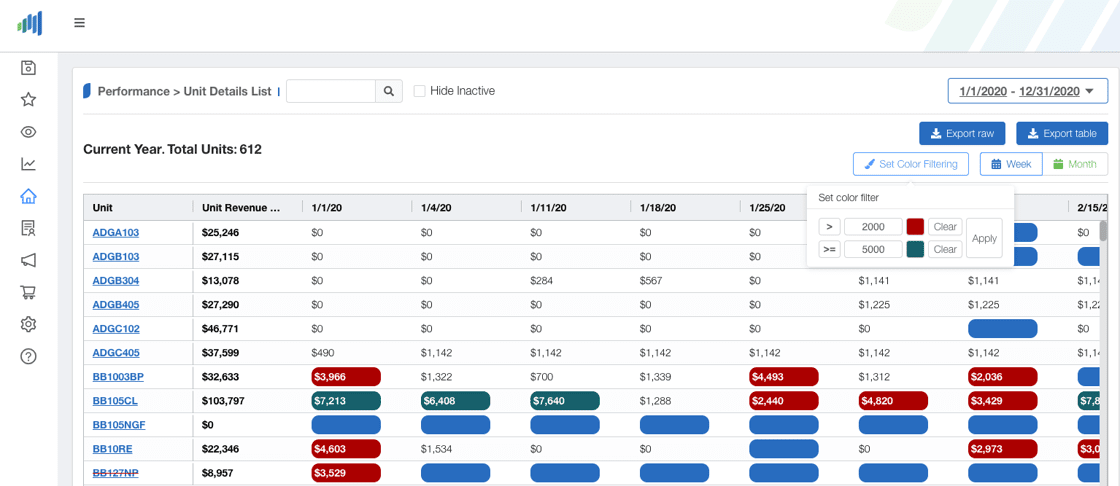
1. Dual Color Filtering: You can now visually add two-color filtering rules at once to easily identify separate ranges in your data.
2. Guest Checkouts has been added as a new KPI.
3. Feeder Markets: You can now view Feeder Markets by booking date or arrival date.
4. Owner Reports: When printing, hidden graph values are also hidden from the graph legend.
5. Single Unit Details: OTA Supply tab pre-filters the new OTA Supply view based on the criteria of the unit you’re viewing to more quickly give insight into overall market supply in relation to that unit.
6. The Unit Groupings page and print view now include a title that reflects the date range and selected KPI.
7. Inactive Units can now be hidden on the Leaderboard and Unit Details List.
8. In the daily chart breakdown, you can view date ranges up to 90 days.
9. Added “Next 60 Days” as a pre-set date range.