What is pickup?
Pickup is the number of reservations made in a recent period for future guest stays. It helps you understand your booking pace and what arrival windows are popular so you can adjust your management strategy appropriately.
 When should I track it?
Regularly. It can help to set a schedule for when you’ll check your pickup reports. You should check them more often during your peak travel and booking seasons. Once a week is often an appropriate schedule, but if you have the time, you may want to check the report more often during busy seasons.
How do I track it?
Below, we’ll walk through two options to dive deep into pickup at the company and unit level with Key Data. You may not need to follow all of these steps for all of your units every week, but starting with the broad overview should be a crucial part of your revenue management strategy.
1. The Pacing Report
Questions we can answer: For what dates are people making reservations? Are people making reservations?
Report to use: Pacing Detail under Company in the sidebar.
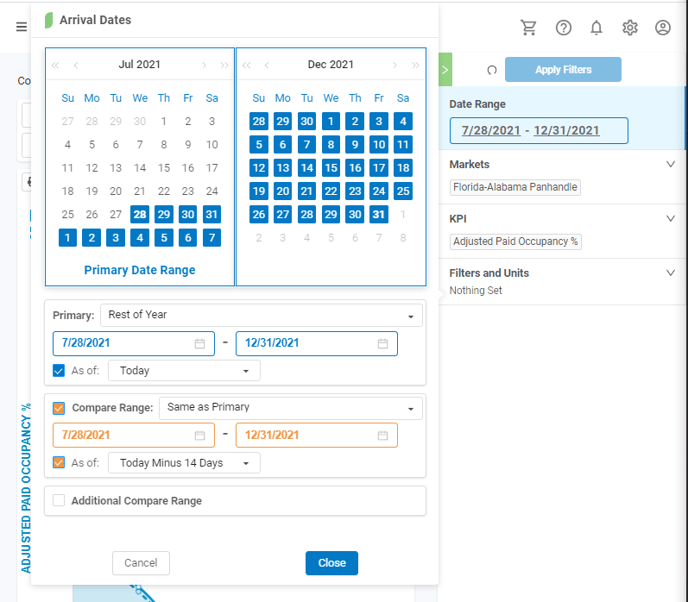
Settings:
Primary date range: Usually about next six months, depending on your market’s booking window. Here, we did Rest of Year.
Primary as of date: Today
Compare date range: Same as primary.
Primary as of date: Today minus 14 days.
KPI: Adjusted Paid Occupancy %
Report:
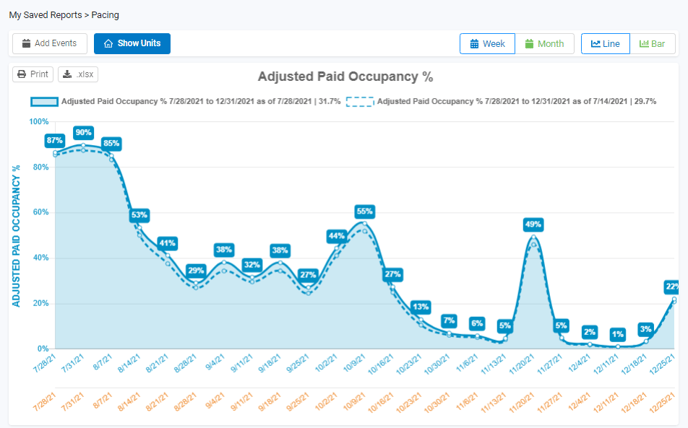
Things to look for: Where has the current solid line risen above the dashed line from two weeks ago? Those weeks are when people are currently booking. In our example, people are currently booking stays during the first and third weeks of September, the first week of October, and Thanksgiving. Occupancy has increased by about 5% for each of those weeks over the last 14 days.
If pick up is slow, you can run the same report for the same time last year. It may just not be a busy booking season for your market.
Dive deeper: How does this vary by different inventory segments?
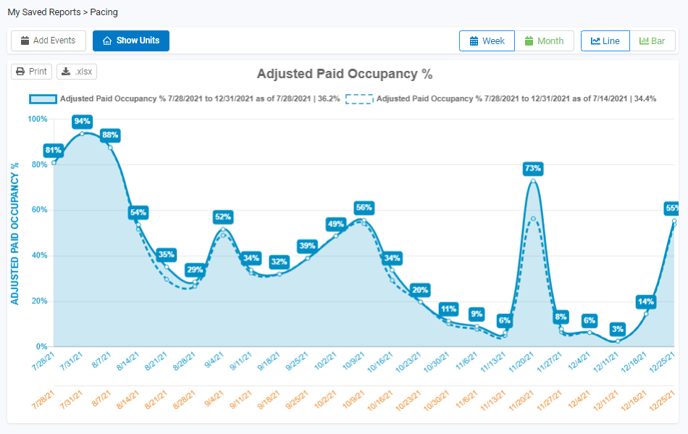
In our example, we narrowed it down to seven bedroom homes. Unlike our overall inventory, seven bedroom houses are not receiving reservations for September and the two lines are nearly identical. However, they’re receiving more Thanksgiving bookings and the occupancy rate for Thanksgiving week increased by 16% in the last two weeks. Families are looking for larger houses to spend the holiday in. With a 27% vacancy rate, there are still homes available, which means you have the opportunity to adjust rates accordingly.
Actions to take: Adjust pricing and marketing based on these new insights. If unexpected weeks have high demand then you may need to raise prices for those weeks.
2. The Leaderboard
Questions we can answer: Which units are receiving new reservations? Which units need some attention?
Report to use: Leaderboard under Units in the sidebar.
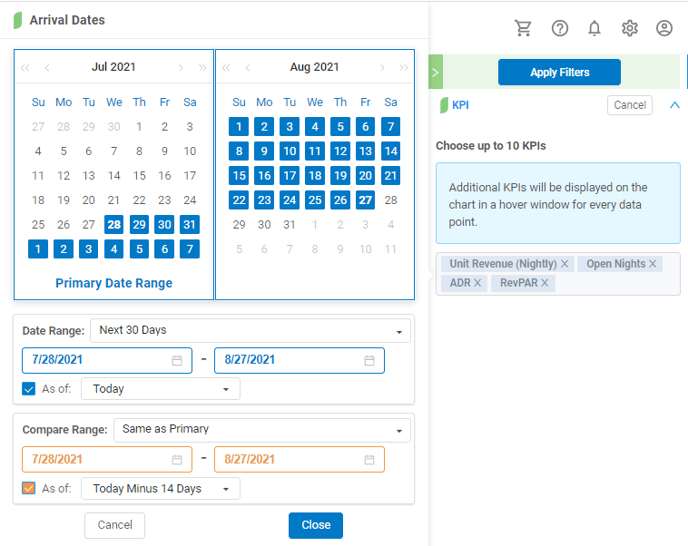
Settings:
Primary date range: Keep the dates shorter with a more actionable timeline. Here, we did the next 30 days.
Primary as of date: Today
Compare date range: Same as primary.
Primary as of date: Today minus 14 days.
KPIs: Unit Revenue, Open Nights, ADR, RevPAR
Report:
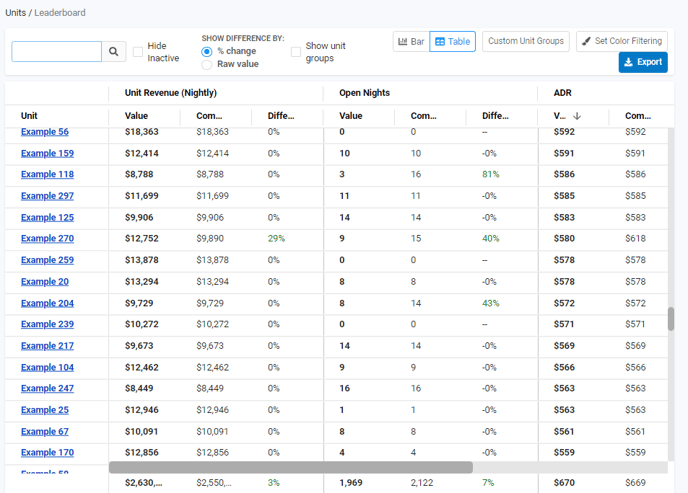
Things to look for: Which properties have a substantial number of open nights in the next 30 days and haven’t received any reservations in the past two weeks? If other properties in your inventory are booking, then you may need to reassess your strategy for the properties that are not booking. In the example report, properties Example 212 and Example 125 show a need for some attention. Both have 14 days left open and have not received reservations in the last 30 days.
For the properties with a lot of nights open, when are those nights? It may be possible to fill those gaps.
Dive deeper: How are similar properties performing? In this report, we’ve narrowed it down to four bedroom houses. Example 247 stands out as a property with more open nights that hasn’t received new reservations. While 247’s ADR is in line with other properties, it may be a little high for this specific property. Examples 125 and 217 may also need some evaluation.

Actions to take: Now that you know how individual units are doing, you can dig into your strategy for them. Based on how they’re booking (or not booking), especially compared to similar properties, you can evaluate your pricing, marketing, reviews, and photos.