What Is This Home Page?
The Home Page in your Key Data Dashboard is your command center for understanding and optimizing your vacation rental portfolio's forward-looking performance. This portfolio performance home page is designed to help you see what's coming and take action before opportunities are missed.
At the top of the page, you can select your Market area(s) and projection window—60, 90, or 120 days ahead—and the entire home page adjusts to show you how your properties are pacing for that future period compared to last year and your local market.

Performance Summary - Core Insights at a Glance
Key Measurement Standards
All metrics follow consistent calculation methods:
- Unit Revenue (Recognized) = Total unit revenue based upon revenue attribution chosen in Settings
- Adj. Paid Occ %= Guest nights sold ÷ Nights Available
- ADR = Unit Revenue (Nightly) ÷ Guest nights sold
- Adj. RevPAR = Unit Revenue (Nightly) ÷ Nights Available
- Year-over-Year Changes = Compare the same future dates at the same point in the booking cycle in the past
- Gap to Market = Your metric minus the market average
Money values are shown in whole currency values. Percentages are rounded to one decimal place for clarity.
My Performance vs. Last Year
See your critical metrics—Unit Revenue, Adj. Paid Occ %, ADR, and Adj. RevPAR (Revenue per Available Room)—for the selected projection window, with year-over-year percentage changes clearly marked. Green indicators show growth; red indicates decline. This gives you an instant read on whether you're ahead or behind where you were at this same point last year.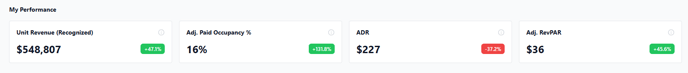
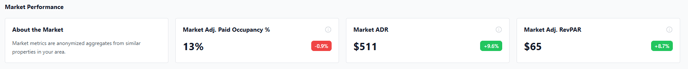
Market Performance Benchmarks
Compare your portfolio's performance trends against anonymized market data from comparable properties in your area. You'll see how your occupancy, ADR, and Adj. RevPAR stack up against the market average—helping you understand whether your performance issues are unique to your properties or reflect broader market trends.
Performance Deep Dives
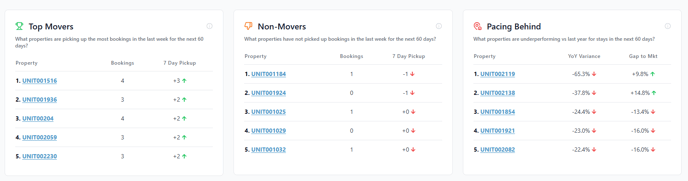
Who's Moving (and Who Isn't)
Top Movers: Identifies properties gaining the most new bookings in the last 7 days for your projection window. These are your momentum properties—what's working right now.
Non-Movers: Highlights properties that received zero new bookings or net booking losses in the past week. These units need immediate attention before their arrival dates approach with empty nights.
Pacing Behind: Flags properties showing warning signs, such as occupancy significantly below market standards, booking pace trailing last year by 10% or more, or other performance concerns. Early identification gives you time to intervene.
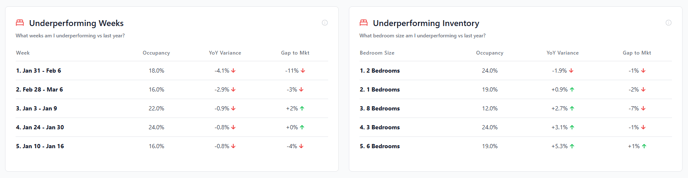
Where Performance Is Lagging
Underperforming Weeks: Pinpoints specific weeks in your projection range where your booking pace is behind last year, ranked by the severity of the gap and the amount of available inventory at stake.
Underperforming Inventory: Groups your properties by bedroom count and reveals which property types (1BR, 2BR, 3BR+) are falling behind their historical performance and market benchmarks. This helps you focus pricing or marketing strategies on specific inventory segments.
AI-Powered Strategic Guidance
Toward the bottom of the Home Page, you'll find AI-generated Performance Breakdown insights section that analyzes all your performance data and translates it into clear, actionable guidance:
What's Working
Celebrates your wins—where you're beating last year, outperforming the market, or seeing strong momentum. Understanding success patterns helps you replicate what's working across other properties.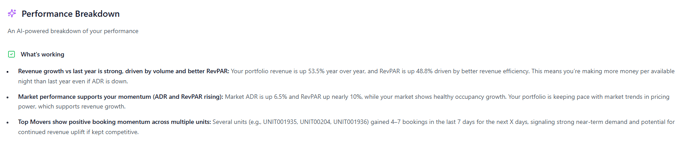
Needs Attention
Surfaces performance gaps, risks, and concerning trends before they become serious problems. This includes occupancy shortfalls, revenue concentration risks, and seasonal weakness patterns.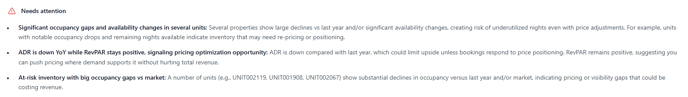
Next Moves
Offers practical, optional suggestions tailored to your specific situation—such as pricing adjustments, minimum stay changes, targeted promotions, or owner communications. These recommendations are presented supportively ("You might consider...") rather than prescriptively, keeping you in control of strategy decisions.
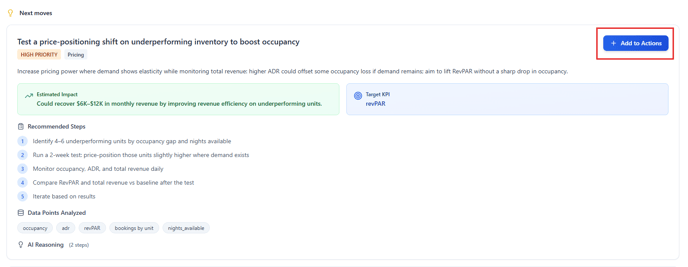
Keep your Actionable Items in one place
Quickly and easily create an Actionable Items list by clicking + Add to Actions. You can tailor your Action Item if you wish to adjust the Title, Description, Priority, or Initial Status before Creating your Action.
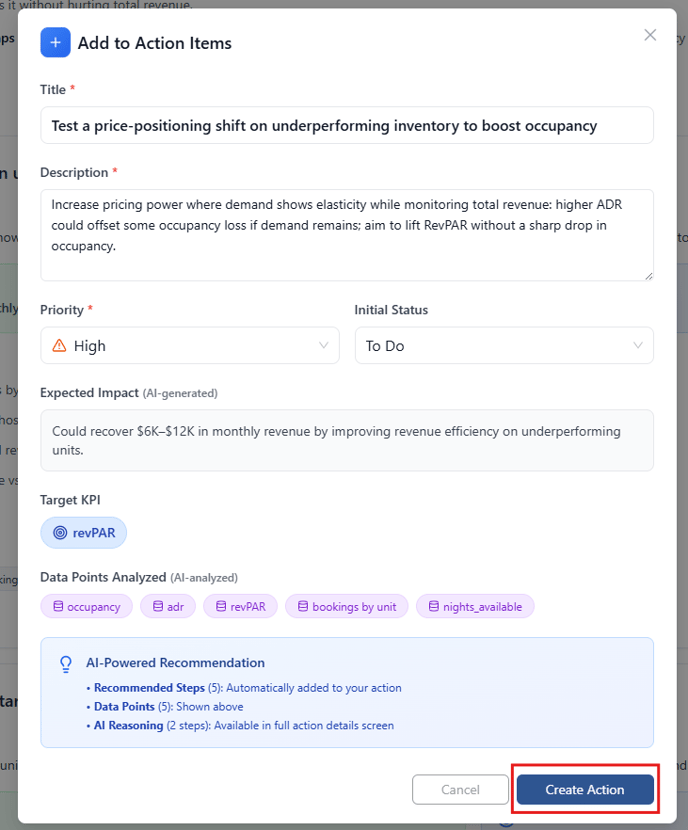
Save Actions, track them, and monitor their progress directly in your dashboard via the left-side menu.
Dex AI turns dashboards into stories, explaining why your performance changed and giving you clear data-backed actions to grow revenue and save time.
How This Helps You Manage Smarter
This home page shows you what's coming with enough lead time to change the outcome. By combining:
- Forward-looking pacing data (how you're booking for future dates 60/90/120 days out)
- Historical pacing comparisons (how you're doing versus last year at this point)
- Market benchmarking (how you compare to competition)
- Dex AI-powered pattern recognition (what the data means and what to do about it)
You can gain the insights needed to optimize pricing, adjust marketing focus, communicate proactively with property owners, and maximize revenue potential across your entire portfolio.
Whether you manage 10 properties or 1000, this home page gives you clarity on where to focus your attention right now to improve outcomes for the weeks and months ahead.