Introducing the Inventory Growth & Churn Dashboard
Finally, Clear Visibility Into Your Portfolio's Health
Track Properties Added, Lost, and Net Growth—All in One Place
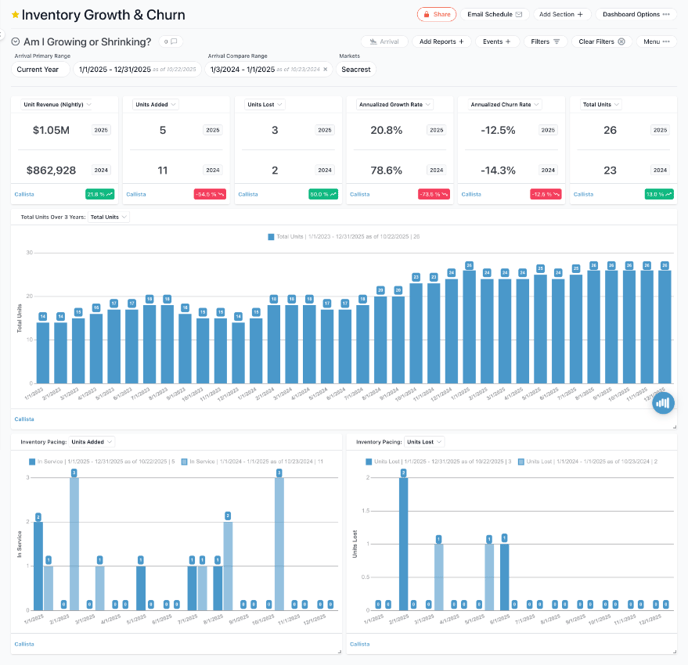
We're excited to announce the launch of our new Inventory Growth & Churn Dashboard, now available to all Key Data customers. This industry-first dashboard gives professional property managers the visibility they've been missing: a clear, automated view of how their portfolio is growing—or shrinking—over time.
Why This Matters
For years, property managers have relied on occupancy rates and revenue metrics to gauge business health. But there's been a critical blind spot: inventory changes. Without tracking which properties you're gaining and losing, you can't tell if revenue shifts are due to performance improvements or simply changes in portfolio size.
Until now, tracking growth and churn required manual data exports, spreadsheet gymnastics, and guesswork. Worse, there's been no way to compare your growth and churn rates against the broader market—leaving you in the dark about whether you're truly competitive.
That changes today.
What You Get
The new Inventory Growth & Churn Dashboard provides:
Automated KPIs Powered by Direct-Source Data
- Total Units – Properties active in your portfolio
- Units Added – New properties brought into service
- Units Lost – Properties removed from your portfolio
- Net New Units – Your actual portfolio growth
- Annualized Growth Rate – 12-month view of expansion velocity
- Annualized Churn Rate – 12-month view of property losses
- Annualized Net Growth Rate – Complete picture of portfolio change
Three Powerful Dashboard Sections
1. Am I Growing or Shrinking as a Company?
Get an instant snapshot of your business health with unit revenue metrics, total units over time, and year-over-year comparisons that show exactly where you stand.
2. When Are Properties Being Added or Lost?
Understand the timing and velocity of portfolio changes with monthly trend charts and annualized metrics that reveal patterns in your growth and churn cycles.
3. What Property Types Are Driving Growth and Churn?
Dig deeper with breakdowns by bedroom size and unit type. Discover if your growth is concentrated in high-value properties or if churn is disproportionately affecting certain segments.
Real Business Impact
This dashboard empowers you to:
✅ Set and track growth goals with clear, measurable KPIs
✅ Identify churn risks early and take action to improve retention
✅ Understand revenue drivers by separating performance from inventory changes
✅ Prepare for valuation or investment with predictable growth data
✅ Compare against market benchmarks (with Enhanced Benchmarking Package)
Use growth and churn metrics to measure company health, drive owner retention strategies, and demonstrate value to stakeholders.
Revenue Managers use the same data to understand how inventory changes affect ADR, RevPAR, and overall revenue trends—helping them diagnose whether performance shifts are due to pricing strategies or portfolio composition.
Together, you can set joint growth and retention strategies backed by accurate, automated data.
Pricing & Availability
Inventory Growth & Churn dashboard: Now included at no additional cost for all Key Data ProData customers
Enhanced Benchmarking market reports: Available with Enhanced Benchmarking Package
Get Started Today
Ready to see your portfolio's growth story?
📊 View Inventory Growth & Churn today!
The Inventory Growth & Churn Dashboard is live in your Key Data account now. Look for it in Dashboards left-side menu > Inventory Growth & Churn to start tracking your portfolio's health.
Questions?
We're here to help! Contact your Partner Success Manager or reach out to our support team to learn more about maximizing the value of your new Growth & Churn insights.
This dashboard represents Key Data's commitment to providing property managers with unique, actionable insights that don't exist anywhere else in the industry. We can't wait to see how you use it to drive your business forward.
![keydata-logo-fullcolor-4.png]](https://support.keydatadashboard.com/hs-fs/hubfs/keydata-logo-fullcolor-4.png?height=50&name=keydata-logo-fullcolor-4.png)
