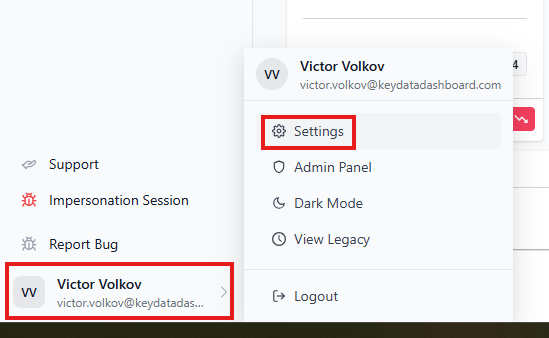
To begin, click on Your name in the bottom left corner > Settings.

Go to Seasons & Events and click on Add New to create a new event.
Click on New Event and enter your event's name. We recommend making the name as descriptive as possible by including the year of the event (i.e. Easter 2026)
Choose start (From) and end (To) dates in the date ranges. If this event is a single day, click on the toggle next to Single Day Event to activate this and select the event date in the "From" dropdown. Then, click Save.

To view your events on the charts, click on Events + at the top of a section to access your events and seasons.

To Show selected Events & Seasons on the charts, click on the toggle to activate.
Click on the checkbox(es) to activate each event and/or season that you want to see on the charts. You can also use the "All Types" filter to quickly view a list of only Seasons or only Events that you have created.
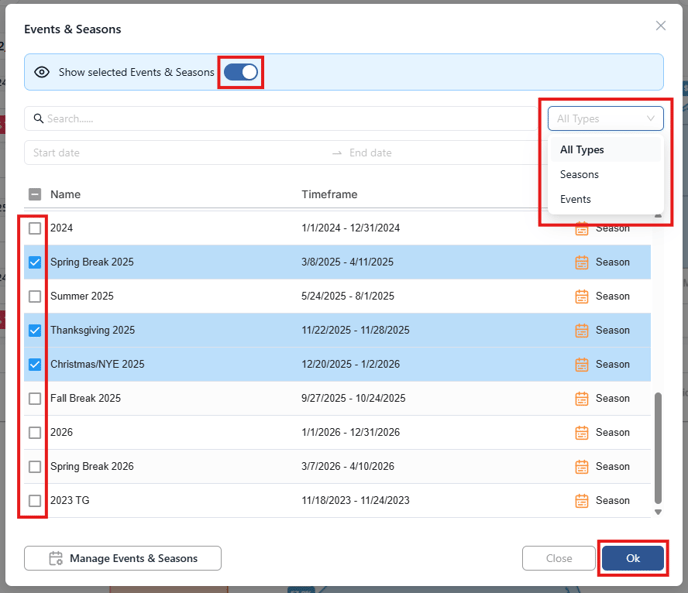
After turning the toggle on + selecting your Seasons & Events you want to view, click Ok to return to your dashboard reports.
![]()
Your Pacing Detail and Benchmarking charts will now show the Seasons & Events that you've selected to view. Note that if your season or event dates fall outside of your Primary Date Range selected in the Filters, your season/event will not be shown on the chart.
